Introduction to Stackdriver APM and its functioning
Introduction to Stackdriver APM and its functioning
11 September 2020
Stackdriver is a service which offers monitoring to our systems in various ways, including Stackdriver metrics, logs and error reporting. In March 2018, Google introduced a suite of tools called Stackdriver APM, for developers to make applications faster and reliable. These tools are very powerful and can be used in applications running anywhere on on-premises infrastructure, Google Cloud Platform (GCP), AWS or a hybrid of both.
Using Stackdriver APM, developers can analyze and debug the applications while they are running on production without impacting user experience. Also, they can profile and explore how their code is actually executing in production to optimize performance and reduce cost of computation.
Stackdriver APM consists of these tools
- Stackdriver Profiler
- Stackdriver Debugger
- Stackdriver Trace
Adding these tools with Stackdriver Monitoring and logging tools, provides a complete suite of Stackdriver APM.
To get started with Stackdriver APM, one needs to link the appropriate instrumentation library for each tool to their app and start gathering telemetry for analysis.
Stackdriver Profiler
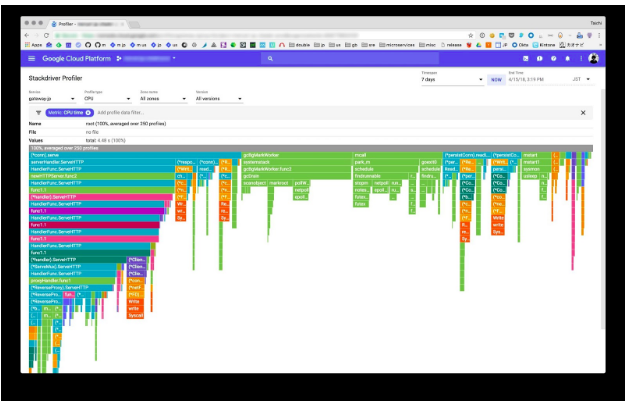
To optimize the performance, and reduce the latency and cost of application and web services, the Stackdriver profiler continuously analyzes the performance of CPU or memory intensive functions executed across an application. It uses an interactive flame graph to show the call hierarchy and resource consumption of the respective function so that developers can understand which path consumes the most resources and the different ways which have been followed actually by their code to be called. This helps in identifying the performance issues and inefficient written code.

Stackdriver Debugger
Stackdriver Debugger is used to find those issues which are difficult to reproduce locally. However, the issue only occurs under extreme load or when running in the production environment.
Stackdriver debugger allows developers to set breakpoints in running services. Unlike traditional debuggers, Stackdriver Debugger does not halt the application process when these breakpoints are triggered. Rather, it will take a snapshot of the application state, which can be used later to investigate things such as variable values and call stacks. This means that the end users aren’t affected by the debugging process, allowing developers to effectively debug the production system.
Stackdriver Trace
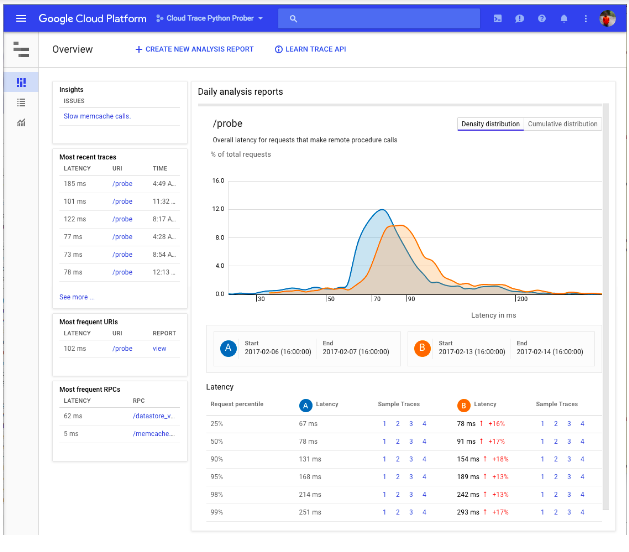
Stackdriver Trace provides visual analytics to inspect the detailed latency information about a single request or view the aggregate latency of the entire application. This also shows how the requests propagate through the application and provides insights of a real-time performance.
Stackdriver Trace continuously collects the trace data and analyzes it to identify the changes occurred in application performance. Various tools and filters of trace can be applied to find out exactly where the issue is occurring and the root cause of it.


