

What is chart.js:
Chart.js is an open-source library that permits us to draw various kinds of diagrams like Line, Bar, Radar utilizing the Canvas Element.
How to use chart.js in Application:
You can implement Chart.js in a simple way with the following instructions:
- Create a new project with angular-cli,we can use the command as below:ng new sample-chartjs
- Install Chart.js in your projectnpm install chart.js
- Import Chart into its componentimport Chart from ‘chart.js’;
- Use Chart in your view and component :Chart.js requires an <canvas> element containing the unique id of the chart for the data to render in the HTML template. We can set height and width for the linechart.
<canvas id=”lineChart” width=”400” height=”400”></canvas>
A Chart has 3 main sections:
- Type Of Chart: type
- Plotting the data
- Features of Chart
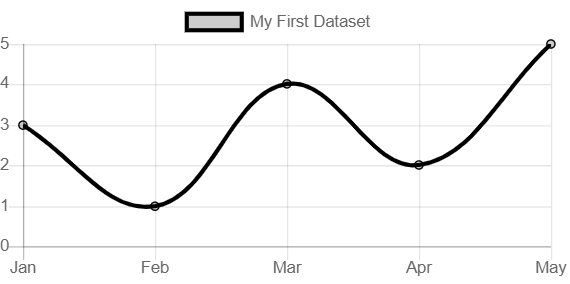
Type of chart:
The type of chart is specified in type. It takes a string input that is the type of chart you want to make.
Inputs can be: line, bar, radar, doughnut, pie, polarArea, bubble & scatter.
Example: type:’line’
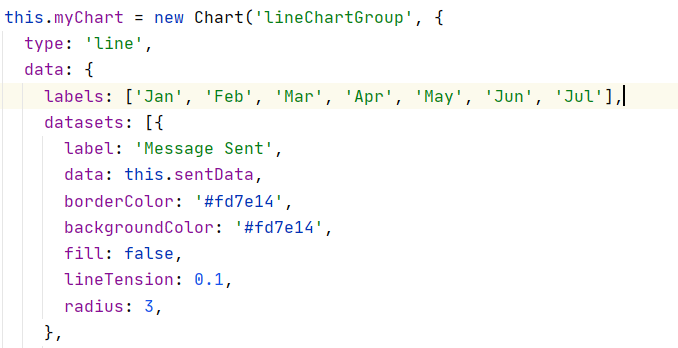
Plotting the data:
Here we can add the data that we need to plot on the chart. Creating a lineChart then needs to add color , label ,datasets,tooltip and position etc.
DataSets: This is where we put the actual data.Dataset is an array of objects. Each object must contain data: array. We can add labels for the dataset
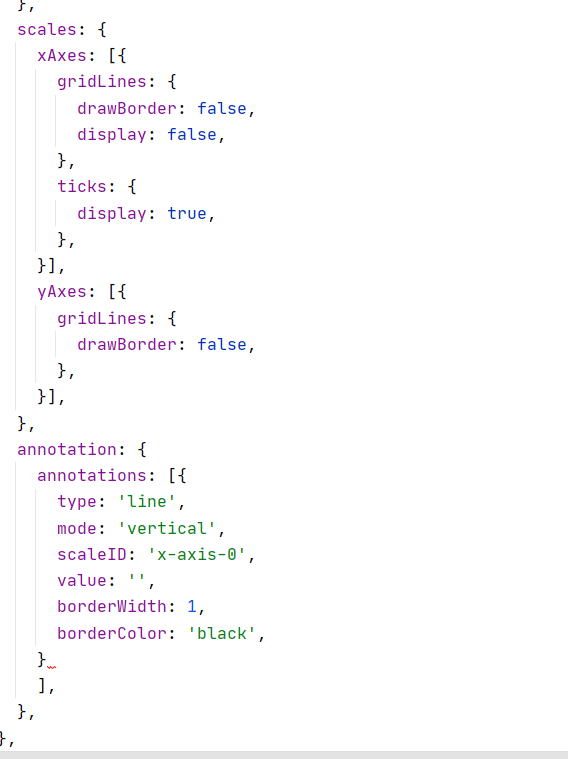
Fearures of charts:
Here we can decide to add gridlines or not, what should be the range on both the axis and much more. Also, you can add plugins.
scales: For each axis, you should have a separate value, i.e., one for the x-axis and one for the y axis.
plugins: Plugins let you customize the charts. Say you want to add an Annotations plugin, using this we can add horizontal or vertical lines in the chart. For this, we need to install the plugin and import it into a particular component and we need to add type, mode, and scale-Id.
As we saw through the above examples, using that created a line chart added options, animations, and plugins to chart.